Tag Archives: Information Gathering

Interesting scanner

I know I’m probably the only one in this island that thinks this as interesting, but nevertheless…

It’s normal for the web server to get scanned by other “inquisitive” people/machines/bots, but this tool looks pretty interesting…  Will dig deeper into this later.

The scanners typically try to detect whether I’m running certain vulnerable versions of web apps for them to exploit.  So when the web app does not exist, guess what happens? 😉

This particular scan was interesting, because of the user agent field.  Check it out:

200.6.121.56 – – [17/Jul/2010:14:51:06 +0800] “GET /roundcubemail-0.1//bin/msgimport HTTP/1.1” 404 136 “-” “Toata dragostea mea pentru diavola
200.6.121.56 – – [17/Jul/2010:14:51:06 +0800] “GET /bin/msgimport HTTP/1.1” 404 136 “-” “Toata dragostea mea pentru diavola”
200.6.121.56 – – [17/Jul/2010:14:51:06 +0800] “GET /wm//bin/msgimport HTTP/1.1” 404 136 “-” “Toata dragostea mea pentru diavola”
200.6.121.56 – – [17/Jul/2010:14:51:06 +0800] “GET /webmail//bin/msgimport HTTP/1.1” 404 136 “-” “Toata dragostea mea pentru diavola”
200.6.121.56 – – [17/Jul/2010:14:51:06 +0800] “GET /webmail2//bin/msgimport HTTP/1.1” 404 136 “-” “Toata dragostea mea pentru diavola”
200.6.121.56 – – [17/Jul/2010:14:51:05 +0800] “GET /rms//bin/msgimport HTTP/1.1” 404 136 “-” “Toata dragostea mea pentru diavola”
200.6.121.56 – – [17/Jul/2010:14:51:05 +0800] “GET /roundcubemail//bin/msgimport HTTP/1.1” 404 136 “-” “Toata dragostea mea pentru diavola”
200.6.121.56 – – [17/Jul/2010:14:51:05 +0800] “GET /mail2//bin/msgimport HTTP/1.1” 404 136 “-” “Toata dragostea mea pentru diavola”
200.6.121.56 – – [17/Jul/2010:14:51:05 +0800] “GET /mail//bin/msgimport HTTP/1.1” 404 136 “-” “Toata dragostea mea pentru diavola”
200.6.121.56 – – [17/Jul/2010:14:51:04 +0800] “GET /mss2//bin/msgimport HTTP/1.1” 404 136 “-” “Toata dragostea mea pentru diavola”
200.6.121.56 – – [17/Jul/2010:14:51:04 +0800] “GET /rc//bin/msgimport HTTP/1.1” 404 136 “-” “Toata dragostea mea pentru diavola”

If anyone knows more about this particular scanner, feel free to comment and share!

Edit (19 Jul): it seems that I’ve joined the ranks of those who’ve been scanned one way or another.  Apparently it is in Romanian, meaning “All my love for the devil”.

Profiling client internet connections

Some more fun with p0f and Splunk…Now with profiling of client internet connections!

Setup of the p0f and logging is the same as in the OS Profiling post.

The Splunk search string has been extended to extract the source’s internet link as a field too (go for the portion in bold for the field extracting commands):

| file /home/path/to/p0f.log | rex field=_raw “> (?<srcip>[^:]+):(?<srcport>[^ ]+) – (?<srcos>.+?) (” | rex field=_raw “-> (?<dstip>[^:]+):(?<dstport>[^ ]+) ” | rex field=_raw “link: (?<srclink>.*))$” |  regex srclink!=”(unspecified|unknown)” | top limit=0 srclink

The fields that I extract with this:

  • srcip -> source IP
  • srcport -> source TCP port
  • srcos -> source’s OS (woot!)
  • dstip -> destination IP (which is my machine’s)
  • dstport -> the destination port which the TCP connection was initiated to
  • srclink -> the internet link of the source machine

After filtering out the “unspecified” and “unknown” links, the list of the detected links are as follows:

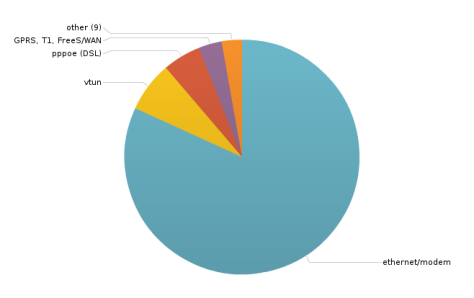
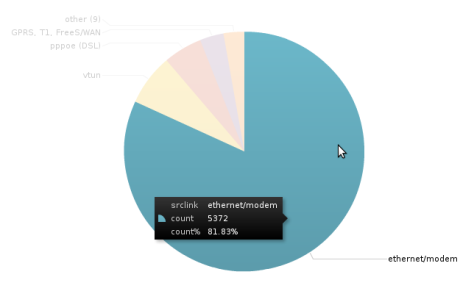
“ethernet/modem” points to mostly cable connections.  There’re some interesting entries in the list though, like vtun, pppoe, Google/AOL, IPv6/IPIP (early adopters? haha).  Don’t have any idea on what’s IPSec/GRE, or vLAN here in this context though.

Just for the heck of it, here’s the chart for this table, generated from the reports link in Splunk.

I like the charts, because they allow some interaction with the charts for simple datasets, but I digress 😛

OS Profiling

Trying out p0f along with Splunk..

p0f allows you to determine the OS of the remote machine based on the TCP fields characteristics.  It can also tell whether the machine is behind a firewall, what kind of internet connection it is running from…pretty useful for information junkies like me 😀

Here’s what I did:

./p0f -t -u MyUseridHere -i eth0 ‘src not MyIPAddressHere’ | tee -a p0f.log

Runs p0f, logging with actual timestamps (-t), chroot and setuid to MyUserIdHere (-u), listening on eth0 (-i), and filtering out packets for connections initiated from my machine itself (since I’m not interested in profiling my own machine).

tee is a (really nifty!) linux command.  What it does is to “split” the input (stdin) to two parts: stdout and the file specified.  The -a option tells it to append to the file instead of overwriting it.

Using this, p0f outputs logs like this one:

<Sat Jul  3 07:03:56 2010> 175.40.12.47:1095 – Windows 2000 SP2+, XP SP1+ (seldom 98)
-> 74.207.229.183:80 (distance 12, link: sometimes DSL (2))

One of the Splunk queries that I poked around with:

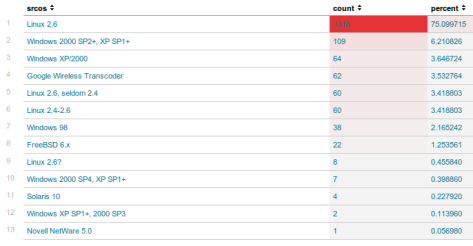
| file /path/to/p0f.log | rex field=_raw “> (?<srcip>[^:]+):(?<srcport>[^ ]+) – (?<srcos>.+?) (” | rex field=_raw “-> (?<dstip>[^:]+):(?<dstport>[^ ]+) ” | regex srcos!=”UNKNOWN” | top limit=0 srcos

This query extracts out the source and destination IP and port, and the source OS.  Then after filtering out the OS tagged with UNKNOWN, the remaining entries are ranked…

The resulting chart, of not much real interest by itself, just shows that other than that the connections are predominantly from linux machines (hurhur), and there’s a connection from a really old Netware machine (5 was released in Oct 1998!).