Well, have worked the stuff from my previous post into a set of scripts, just to share. For more on the visualizing of binary samples and why/how it works, you can refer to that post for more details.
You can download the code here. You need to have gnuplot installed. And yes, this runs in Linux (perhaps it could run in cygwin too, but YMMV).
Edit: this has been worked into a set of scripts for downloading here.
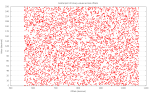
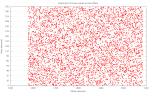
One of the other weird ideas I had (which was more possible for me to implement at this stage) was to visualize the content of binary data in a way that showed its characteristics at a glance. Analyzing binary data appears to be one of the things you do a lot in DFIR work when you are faced with cryptanalysis tasks.
A couple of questions that came to mind when looking at a set of binary data were:
Which offsets had relatively constant binary values?
What are the range of binary values that can be observed from these offsets?
Nutjobs like me actually LIKE looking at such stuff
Had this crazy idea for a tool/set of scripts that automatically helped to convert any binary into a bitmap and compared these bitmaps to generate visualizations like heat maps and the like. Might come in handy for DFIR and related tasks…
…and thus, after a couple of hours tinkering around, I have the first component ready! So here’s just a scratchpad post to document the main “results” first: how to convert a given binary into a bitmap.


")

